
AGV Drive Wheel Gearbox Torque Calculation
Screen peak torque, motor duty and traction per drive wheel. Edit mass below, then open the parameter groups. Preliminary sizing only.
Published: · Method reviewed:
Request engineering reviewCalculate per-wheel torque
Method and limits1–20000 kg
0–50000 kg
Raw peak envelope
39.8
N·m / wheel
Phase-envelope RMS
16.1
N·m / wheel
Motor maximum speed
3581
rpm
Straight-line traction
56.8
% of model limit
Straight-line demand is below model limit.
Verify grip and load transfer on the actual floor; turning adhesion remains unknown. These results exclude rotating inertia and impact loads. RMS screens motor duty; it does not establish gearbox fatigue life or thermal capacity.
Updates instantly; all inputs are required. Example values, including turning torque, are assumptions to replace with measurements. No supplier capacity has been entered.
Vehicle and loaded wheel geometry
Equal drive sharing; conventional traction wheels only. Fraction is the share of normal load on all driven wheels. Mecanum and omni rollers require another model.
1–8 ; choose 1, 2, 4, 6 or 8
0.1–1 0–1
50–1000 mm
Motion, slope and measured floor conditions
Acceleration and braking times describe one event, not jerk. Crr covers the whole chassis including passive casters. Enter degrees, not percent grade. Coefficients below are illustrative.
0.05–10 m/s
0.1–30 s
0.1–30 s
0.001–0.2 Crr
0–15 degrees
0.05–1.2 μ
Transmission and bearing demand
K is your screening allowance, not an ISO-prescribed floor factor. Static wheel load is not a bearing capacity or life check. Compare motor speed against the actual supplier curve.
1–200 :1
0.5–0.99 0–1
0–300 mm
1–3 K
Phase exposure and measured turning demand
Seconds are total exposure per representative cycle, so may cover repeated events. Conservative envelope: uphill acceleration/cruise, downhill braking, flat turning and motor-held slope dwell. Turn torque is total wheel-axis torque, not a vertical steering moment.
0–10000 N·m
0–3600 s
0–3600 s
0–3600 s
0–3600 s
0–3600 s
Interpretation and next steps
- RMS × K (1.25)
- 20.1 N·m
- Peak × K (1.25)
- 49.7 N·m
- Motor RMS / peak screen
- 0.86 / 2.12 N·m
- Uphill cruise motor power
- 195 W mechanical
- Static wheel radial load
- 1594 N
- Static overhang moment
- 71.7 N·m
K is a user allowance, not a certified rating. Cruise power is not rated motor power or average battery power. Braking uses a conservative motoring-efficiency torque conversion; verify regenerative limits separately.
Inspect the torque-time envelope
| Phase | N·m | s |
|---|---|---|
| Uphill acceleration | 39.79 | 2.5 |
| Uphill cruise | 9.79 | 18 |
| Downhill controlled braking | 33.90 | 2.5 |
| Measured flat turn | 12.00 | 4 |
| Motor-held slope dwell | 6.84 | 10 |
Unknown: gearbox lifetime and thermal rating, turning grip, motor speed capacity, emergency stop performance and bearing life. Send the screen with a measured torque-speed-time trace for supplier validation.
Request a sizing reviewFour decisions the screen can support
| Decision | Evidence | Action |
|---|---|---|
| Which phase governs? | Peak is the largest of uphill acceleration, cruise, downhill controlled braking, holding and entered turning demand. | Inspect the phase table; retain reverse and transient limits in the RFQ. |
| Is grip a constraint? | Required longitudinal force is compared with μ × driven normal load. | At or above 100%, change demand or verified traction before increasing motor size. Turning remains unchecked. |
| What motor duty should be checked? | RMS weights the phase envelope by time; Oriental Motor describes effective torque for variable motor loads. | Compare RMS and torque-speed points with actual motor/drive curves, voltage and cooling. |
| Is a direct-mounted wheel feasible? | Static wheel load and force × overhang establish two structural demands. | Ask for allowable load at the stated offset, impact envelope and a bearing-life calculation. |
Motor sizing needs torque, speed and inertia checks together. Oriental Motor: motor sizing calculations The equations below are our transparent chassis screening assumptions; the external references do not validate this calculator or its presets.
Method: force, radius, torque and speed
Let m be total vehicle mass, N the number of driven wheels, f the driven normal-load fraction, θ the slope angle, r the loaded rolling radius, Crr the whole-chassis rolling coefficient, i the reduction ratio and η the transmission efficiency. Use SI units and g = 9.80665 m/s².
| Quantity | Equation | Interpretation |
|---|---|---|
| Rolling force | Frr = m g cos(θ) Crr / N | Includes resistance from passive casters through the whole-vehicle coefficient. |
| Grade force | Fg = m g sin(θ) / N | Entire vehicle must be moved uphill by the driven wheels. |
| Acceleration | a = v / ta; Fa = m a / N | Constant mean acceleration. Jerk, rotating parts and torsional transients are excluded. |
| Uphill acceleration torque | Ta = (Frr + Fg + Fa) r | Wheel/output torque before transmission losses. |
| Downhill braking magnitude | Tb = max(0, m v / (N tb) + Fg − Frr) r | Gravity increases braking effort; rolling resistance assists deceleration. |
| Wheel and motor speed | nw = 60 v / (2πr); nm = i nw | A required speed, not proof the chosen motor can deliver it. |
| Motor torque proxy | Tm = Tw / (i η) | Motoring convention; also used conservatively for braking torque, not energy recovery. |
The default gross mass is 500 kg. Its uphill acceleration demand is 39.79 N·m per wheel, wheel speed is 179.0 rpm and motor speed is 3581 rpm. Changing ratio changes shaft speed and torque; it does not remove wheel traction demand.
RMS is a motor-duty screen, not a gearbox lifetime rating
The tool calculates Trms = √[Σ(Tj² tj) / Σtj]. Uphill acceleration and cruise are combined with downhill braking and measured flat turning as an envelope of repeated exposures. Dwell assumes the motor holds on the maximum slope, Thold = Fg r. These are phase magnitudes, not a reconstructed signed trajectory. Zero-duration phases add no RMS contribution; peak still checks the straight-line and holding envelope.
Motor effective-torque methods are described by Oriental Motor: motor sizing calculations. Our conservative exposure model needs replacement with a measured trace for final selection. Gear teeth and bearings do not share a universal square-law damage model. ISO 6336-1:2019 — gear load-capacity principles addresses gear capacity methods; its public scope does not justify calling RMS × K a certified nominal gearbox rating.
The user allowance K multiplies the RMS and peak screens separately. It is not an ISO-prescribed floor coefficient and does not guarantee shock survival. Ask the supplier to define allowable peak duration, reversal frequency, fatigue spectrum, operating temperature and lifetime.
Traction: distinguish a model margin from a safety verdict
The driven normal load is Fz = m g cos(θ) f / N, giving available longitudinal grip μ Fz. The displayed percentage compares uphill acceleration, downhill braking and slope-holding force against that limit. Below 75%, from 75% to below 100%, and at least 100% are screening bands chosen for this interface; only 100% is the simplified Coulomb boundary.
| Screen state | Meaning | Next step |
|---|---|---|
| Below model limit | Longitudinal demand is below μ Fz. Actual wheel load and μ remain uncertain. | Measure loaded-wheel forces and floor grip. |
| Limited model margin | 75–100% of assumed grip; the 75% warning is a UI allowance, not a standard. | Test the worst floor and smooth the motion profile. |
| Exceeds model limit | Demand reaches or exceeds assumed longitudinal grip. | Reduce motion demand or improve verified driven load/grip. |
| Turning / lateral adhesion | Unknown: track geometry and lateral forces are absent. | Use chassis-specific combined-force modelling and tests. |
Turning torque must be measured about the wheel axle. A tire-contact twisting moment about a vertical steering axis cannot be added directly to wheel drive torque. Zero turn exposure produces a straight-line-only screen; it does not imply turns consume no torque.
Bearing demand: preserve the geometry
The tool reports flat-floor static wheel load Fr = m g f / N and overhang moment M = Fr e. Flat-floor load is used for this static structural screen. It does not include longitudinal tire-force resultants, impacts, braking load transfer, internal bearing reactions or housing flexibility.
Do not infer a bearing span from wheel diameter or declare a bearing type adequate from moment alone. Request the supplier’s load-at-offset envelope and internal geometry. ISO 281:2007 — bearing load ratings and life supplies rating-life methods, rather than a universal permissible wheel load.
Three reproducible examples
These are synthetic calculations from the displayed model, not customer incidents, fleet measurements or validated product performance. All unmentioned inputs retain the default values.
| Scenario and premise | Raw peak / RMS | Decision |
|---|---|---|
| Illustrative 500 kg warehouse chassis | 39.79 / 16.11 N·m | Baseline: two driven 160 mm wheels, 2° slope, 1.5 m/s in 1 s. Turn torque is an assumed 12 N·m per wheel; replace it with a measurement. |
| Same chassis, longer acceleration | 33.90 / 13.93 N·m | Acceleration time doubles to 2 s; braking remains 1 s. Peak may remain governed by the unchanged braking envelope. Slower starts alone do not reduce every load case. |
| Same chassis, flat route only | 32.94 / 11.94 N·m | Set slope to 0°: uphill cruise and holding demand fall. This does not establish turning adhesion or an emergency-stop rating. |
To reproduce: choose the 500 kg example; record its phase table; change only single acceleration time to 2 s for example two; reset and change only incline to 0° for example three. Keep phase exposure unchanged so the comparison isolates the selected input.
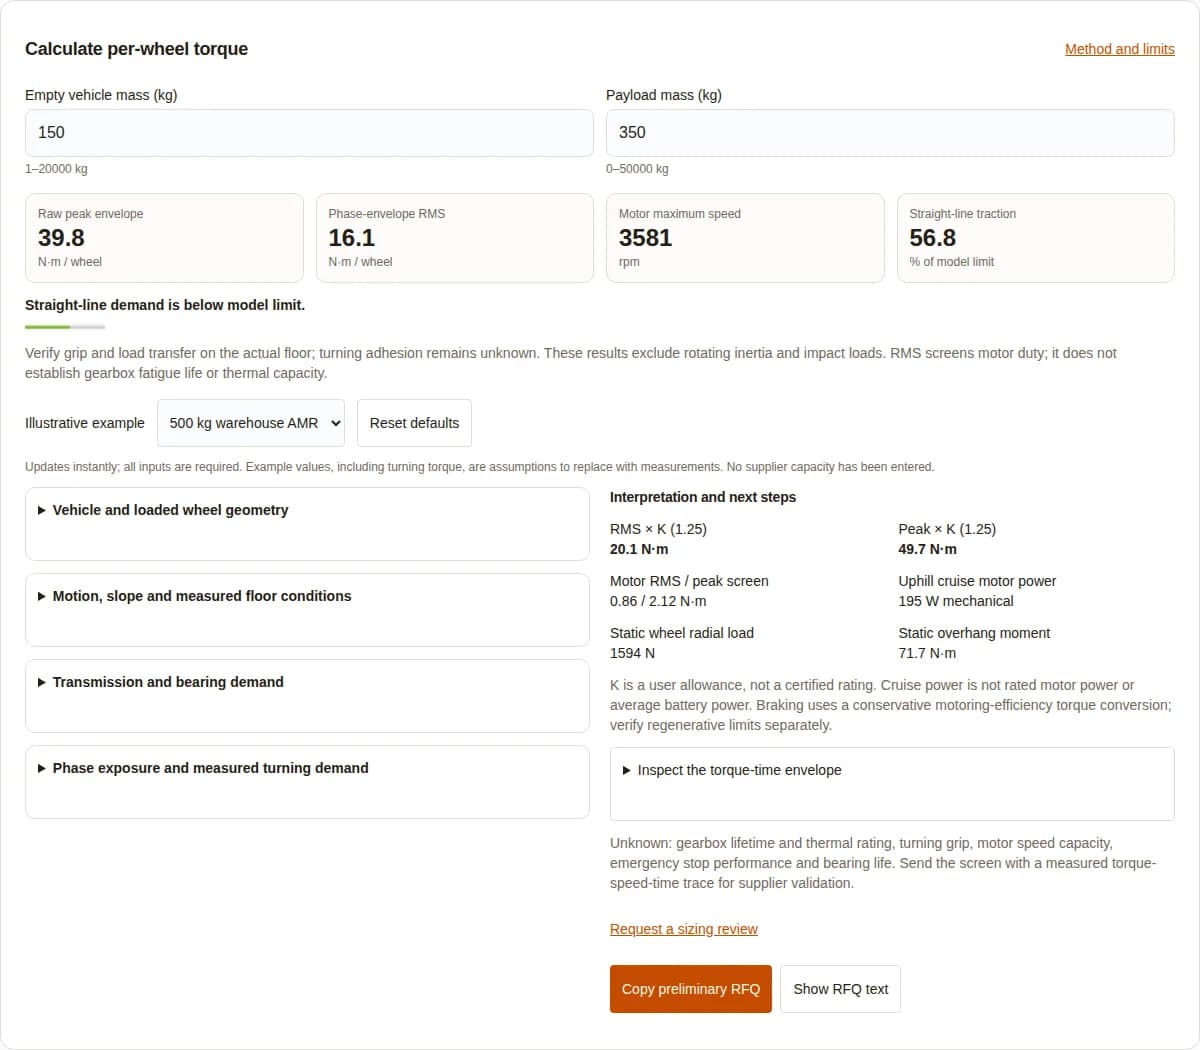
All inputs needed to reproduce the software capture
| Input | Value | Unit |
|---|---|---|
| Empty vehicle mass | 150 | kg |
| Payload mass | 350 | kg |
| Driven wheel count | 2 | dimensionless |
| Drive wheel load fraction | 0.65 | 0–1 |
| Loaded rolling diameter | 160 | mm |
| Maximum travel speed | 1.5 | m/s |
| Single acceleration time | 1 | s |
| Single controlled braking time | 1 | s |
| Whole-vehicle rolling coefficient | 0.015 | Crr |
| Maximum incline angle | 2 | degrees |
| Measured floor traction coefficient | 0.55 | μ |
| Gear reduction ratio | 20 | :1 |
| Assumed transmission efficiency | 0.94 | 0–1 |
| Wheel centre to outer bearing centre | 45 | mm |
| User screening allowance | 1.25 | K |
| Measured total flat-turn torque per wheel | 12 | N·m |
| Total acceleration exposure | 2.5 | s |
| Total cruise exposure | 18 | s |
| Total braking exposure | 2.5 | s |
| Total flat-turn exposure | 4 | s |
| Total slope-holding exposure | 10 | s |
Compare drive arrangements against your load path
| Arrangement | Potential benefit | Cost or mismatch risk | Verification |
|---|---|---|---|
| Integrated wheel hub | Short assembly path and packaged wheel support. | Custom interfaces and bearing replacement can raise service costs. | Verify flange, offset, wheel-change method and allowable load. |
| Inline gearbox with separate wheel bearings | Separates chassis wheel load from the reducer shaft. | Additional bearings, alignment work and chassis space. | Check coupling alignment and mounting stiffness. |
| Right-angle drivetrain | Can package a motor across a narrow chassis. | Extra transmission interfaces and losses depend on design. | Request efficiency and thermal data at real speed and torque. |
| Direct drive | Removes a reduction stage. | Motor must supply the full wheel torque and fit the wheel envelope. | Confirm low-speed thermal performance and drive current. |
Known inputs, unknown capacities and misuse risks
| Check | Status in this tool | Minimum next action |
|---|---|---|
| Vehicle translation and grade | Calculated under equal sharing and fixed load fraction. | Measure wheel loads across payload locations and slopes. |
| Tire deformation and rolling radius | Not predicted; loaded diameter is a user input. | Measure rollout under payload and verify wheel-maker limits. |
| Rotating inertia and control tuning | Unknown; wheels, gears and rotor inertia are excluded. | Add actual inertias, torsional compliance and speed-dependent torque. |
| Turning and uneven wheel sharing | Entered torque only; turning grip is unchecked. | Instrument a representative chassis and retain lateral loads. |
| Gear fatigue and thermal capacity | Unknown; RMS is not a life or temperature model. | Supply spectrum, speed history, lubricant and ambient conditions. |
| Emergency stop and brake response | Unknown; no emergency deceleration is inferred. | Verify full vehicle stopping performance independently. |
| Bearing life and impact loads | Unknown; only static load and overhang moment shown. | Request combined-load, offset and fatigue verification. |
| Battery and inverter limits | Unknown; cruise power is mechanical only. | Check bus voltage, current, regenerative energy and thermal limits. |
Misuse risk: treating a low traction percentage as safe operation ignores lateral forces and load transfer. Cost risk: selecting from peak torque alone can add mass and expense, while selecting from RMS alone can miss transient limits. Scenario mismatch: cold starts, floor joints, contaminated floors and ramps require tests; no universal numeric multipliers are asserted here.
From screen to a reviewable supplier request
- Measure loaded rolling diameter, gross mass, driven-wheel loads and whole-chassis resistance.
- Record signed speed, torque and duration for starts, travel, braking, turns and slope queues. If estimating from current, use the manufacturer’s current convention, torque constant and drive calibration.
- Provide wheel/rotor/gear inertias, bus voltage, cooling, installation space, overhang geometry, payload cases, shock events and required life.
- Ask the supplier to check motor torque-speed limits, gearbox peak cycles, fatigue, heat rejection and bearing life independently.
- Validate a prototype under worst payload, floor, ambient and braking conditions before release.
Thermal verification needs losses and heat rejection. ISO/TR 14179-1:2001 — gear thermal capacity describes an oil-lubricated gear-drive heat balance; transferring its assumptions to a compact grease-filled hub requires justification. Vehicle stopping verification is a separate safety task under the applicable edition of ISO 3691-4:2023 — driverless truck safety. The public scope is not evidence for a universal emergency deceleration value.
Questions about inputs, interpretation and selection
Is the output per wheel or for the vehicle?
All force and torque outputs are per driven wheel. Total chassis and payload mass are divided by the driven-wheel count under equal load sharing.
Why does drive load fraction affect grip but not total rolling resistance?
Driven wheels provide powered grip, but the drive must also overcome passive-caster resistance. Crr therefore represents the whole chassis; the drive fraction only changes the driven normal load.
Do I enter wheel radius or diameter?
Enter loaded rolling diameter in millimetres. The model converts it to radius in metres by dividing by 2000. Use a measured rollout diameter when tire compression matters.
Is incline in degrees or percent?
Degrees. Convert percent grade to an angle with atan(grade/100). A 5% grade is approximately 2.86°, not 5°.
Are the preset values measured vehicle data?
No. All four presets are illustrative, including floor coefficients and turning torque. Replace them with your measured chassis and floor values.
Why are single-event times separate from phase exposure?
Single acceleration and braking times set acceleration magnitude. Phase exposures weight the RMS envelope and can represent multiple events within a cycle.
Does dwell mean zero torque?
Here it means the motor holds the vehicle on the entered maximum slope, so it includes grade-holding torque. A mechanical holding brake changes the motor-duty model and needs a separate trace.
Can I use RMS as the gearbox nominal rating?
No. This RMS is a motor-duty screening proxy. Gear fatigue, speed weighting, allowable cycle counts, lubrication and thermal capacity need the supplier’s specific rating method.
How should I choose K?
K is a user-defined allowance. Agree load uncertainty and shock requirements with the supplier. A scalar multiplier cannot replace a fatigue spectrum or transient impact analysis.
Does a bigger gear ratio solve wheel slip?
No. Ratio changes motor speed and shaft torque, not the required tire-to-floor force for the same vehicle motion. Change the motion demand, measured grip or wheel loading.
How is turn torque obtained?
Enter total measured torque about each driven wheel axle during representative flat turning. Steering torque about a vertical axis cannot be inserted directly. If unavailable, omit turning exposure and treat the result as straight-line only.
Does this support mecanum wheels or skid steering?
Not as a complete sizing model. Roller geometry, lateral scrub, track width, caster alignment and combined tire forces need a chassis-specific model and tests.
Why is there no automatic inertia ratio?
The model has no wheel, gearbox or motor rotor inertia data. Vehicle translational mass is included, but rotating inertia is excluded. A defensible ratio needs actual component inertias and motor data.
Does the tool verify emergency stopping?
No. The braking input describes controlled braking only. Emergency stops, protective fields, response delays, brake engagement and worst-floor tests require separate vehicle safety verification.
Does the radial load establish bearing life?
No. The output is static vertical load and overhang moment. Actual bearing life needs geometry, equivalent combined load, speed history, lubrication, contamination and supplier bearing data.
What should accompany an RFQ?
Send these inputs and assumptions, measured signed torque-speed-time traces, wheel and rotor inertias, temperature conditions, duty repetitions, emergency-stop loads, mounting geometry and required service life.
Send a preliminary sizing brief
Use “Copy preliminary RFQ” in the calculator to include the complete inputs, phase envelope and unknown checks. If turning data is unavailable, set turn exposure to zero and state that limitation in the request.
Related decisions: AGV gearbox sizing & selection guide, duty-cycle load methods, thermal review, supplier qualification, and backlash requirements.
Sources, scope and review date
Published by Robotized Gearbox. Model corrections or application questions: contact the engineering review team. Next source and model review: 2027-05-12, or sooner if supplier data or the calculation method changes.
Public source pages checked on 2026-11-12. Standards entries establish identity and public scope; they do not imply a full normative-text audit or certification. Verify the applicable edition for your contract and market.
- Oriental Motor: motor sizing calculations
Manufacturer guidance on load torque, acceleration torque, speed, inertia and effective motor torque. The chassis envelope below is our stated screening model.
- ISO 6336-1:2019 — gear load-capacity principles
Scope and limitations for cylindrical gear capacity methods; not an assembled-drive approval or a universal AGV floor-factor table.
- ISO 281:2007 — bearing load ratings and life
Bearing rating-life methods. This calculator does not evaluate bearing life or internal bearing reactions.
- ISO/TR 14179-1:2001 — gear thermal capacity
An oil-lubricated gear-drive heat-balance method under stated conditions. It is not a thermal certificate for a grease-filled wheel hub.
- ISO 3691-4:2023 — driverless truck safety
Vehicle safety requirements and verification. No fixed emergency deceleration or safety-field clearance is inferred by this tool.